Chapter 2. Managing graphsAdvanced Grapher has advanced graph management capabilities. You can easily add, remove and duplicate graphs and change their order in the graph list. You can manage graphs with the help of the Graph toolbar (Figure 2.1) and the Graph List window (Figures 2.2 and 2.3). Click  button to hide/show the Graph list. button to hide/show the Graph list. 
Figure 2.1: Graph toolbar
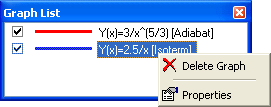
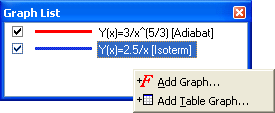
 Figure 2.2: Graph list |  Figure 2.3: Graph list |
Advanced Grapher allows to do the following operations with graphs: - adding new graph. To do it
1. Click  or or  button on the Graph toolbar; or button on the Graph toolbar; or
2. Click the right mouse button on the Graph List window (but not on a title of some graph) and choose the Add Graph or Add Table Graph command from the context menu (Figure 2.3).
The properties of the graph will be set to the default ones. If you choose the Add Table Graph command the type of the graph will be set to Table. You can change the type of the graph with the help of the Graph Properties window.
Hint: if you interrupted the calculating of the graph data and wish to finish the calculating you should use the Graphs | Finish Calculating command from the main menu. - deleting existing graph. To do it
1. Select the graph (with the help of the combo box on the Graph toolbar or the Graph list). Then click  button on the Graph toolbar; or button on the Graph toolbar; or
2. Click the right mouse button on the title of the appropriate graph in the graph list window and choose the Delete command from the context menu (Figure 2.2).
- duplicating existing graph (adding a new graph with the properties of the existing graph). To do it select the graph and then click
 button on the Graph toolbar. button on the Graph toolbar.
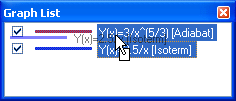
- changing the order of the graphs. This order determines the plotting order of the graphs. Click on a title of the desired graph (on the Figure 2.4 - Y(x)=2.5/x) with the left mouse button and, while not releasing it, drag the title of the over another title which is to follow the chosen title.

Figure 2.4: Changing the order of the graphs - changing properties of the selected graph. You can change different properties of the graph including its design, equation or table etc.
You can change the design properties of the graph with the help of the Graph toolbar (Figure 2.1). You don't need to open any additional windows.
If you want to change other properties of the graph you should
1. Click  button on the Graph toolbar; or button on the Graph toolbar; or
2. Click the right mouse button on the title of the appropriate graph in the graph list window and choose the Properties command from the context menu. You can also double click in the title of the graph to show the Graph Properties dialog.
You can find more information about graph properties in the Chapter 3. | 


