| |||||
|
Chapter 3. Graph propertiesGraphs have various properties, some of which may be shared by other graphs, e.g color and some of them depends on the type of the graph. Each graph has main properties and additional properties. Design properties Each graph has design properties but they differs because they depends on the graph types. E.g. graphs of inequalities don't contain lines so you can't the style of lines for these graphs. The simplest way of changing the design properties of the graph is to use the graph toolbar (Figure 3.1). You can determine to plot the selected graph or not (
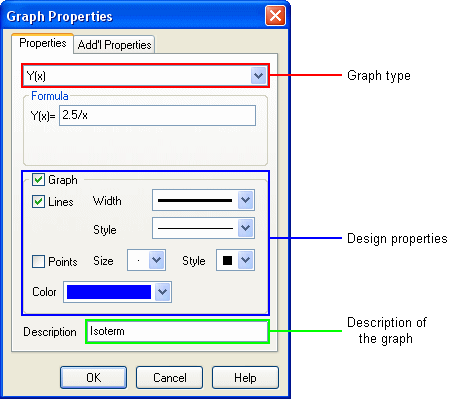
Figure 3.1: Graph toolbar The other way of changing the design properties is using the Graph Properties window. This window also opens when you add or duplicate a graph. Figure 3.2: Graph Properties window Description This property is very useful when you create legend. The description is also shown in the graph list. Y(x), X(y), R(a) - polar graphs, X(t) and Y(t) - parametrical equations These types of graphs are very similar. For each of them you must define equation. You can also define the interval of the independent variable (x, y, a or t). If the interval isn't defined, it is set to the view interval on X or Y. You can define the plot parameters of the graphs. When they aren't defined (Figure 3.3) they are set to the default ones. The default plot parameters are defined in the Document Properties window.
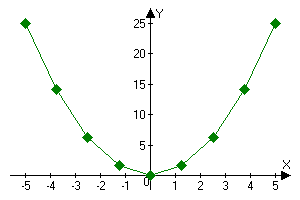
Number of steps determines the accuracy of the plotting. If you'd like to increase the accuracy you should increase the number of steps. Sometimes it's useful to define a small number of steps, e.g. when you plot the graph with points (Fig. 3.5). Number of points of the graph is number of steps plus 1.
Figure 3.5: Graph, number of steps is 8, number of points is 8+1=9 Hint: if you didn't define the plot parameters for several graphs you can change them for these graphs (e.g. to increase the accuracy) by defining the plot parameters in the Document Properties window. Maximum gap is a more complex option. It is a number designating one percent of an interval. If the distance between two adjacent points is more than the maximum gap, these points are not connected with a line (when lines are plotted). Advanced Grapher calculates the gap on X and Y independantly. Then it calculates GapX/IntervalX and GapY/IntervalY. If one of this values is more than maximum gap (e.g. 200%=2) the points aren't connected with a line.
For these graphs you can define intervals, number of steps and maximum gap too.
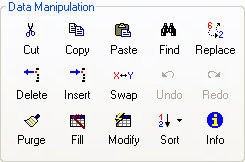
For these graphs you can define intervals, number of horizontal series, number of vertical series and length of the lines. Advanced Grapher has advanced table management capabilities (Figure 3.6).
Figure 3.6: Data manipulation tools Hint: with the help of the cut, copy and paste buttons you can exchange data with Excel and some other spreadsheets. The data may be also read and write to the text files with the help of the File | Import Table and File | Export Table commands. You can also undo up to 15 last operations with table and redo them. You can also define additional properties of the table graphs: type of sorting and smoothing (with cubic splines).
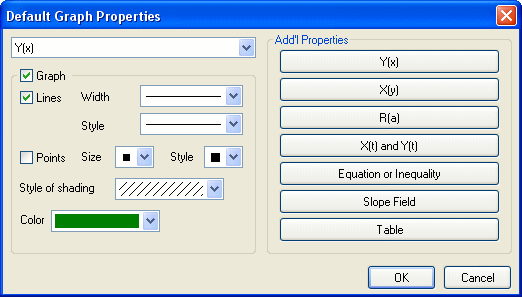
When you add a new graph, its properties are set to the default ones. When you change the graph type (in the Graph Properties window), the additional properties are set to the default ones. You can change the default graph properties with the help of the Default Graph Properties window (Figure 3.7). You can open this window with the help of the Graphs | Default Graph Properties command from the main menu.
Figure 3.7: Default Graph Properties window Hint: if the "New color for new graph" option is ON (Edit | Options) when you add new graph, its color is set to one that is less frequently used. |


