Chapter 4. Document PropertiesDocument properties determines the view of the coordinate plane, intervals and plot options of the graphs. You can determine document properties with the help of the Document Properties dialog. Click  or Graphs | Document Properties from the main menu to open this window. or Graphs | Document Properties from the main menu to open this window. 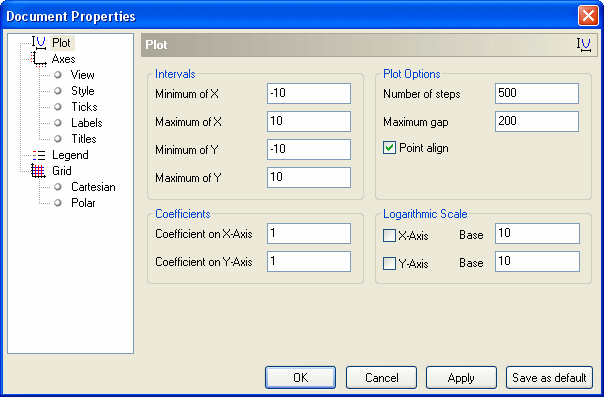
Figure 4.1: Document Properties dialog Plot options These options may be defined with the help of the Plot page. - Intervals. The intervals may also be changed with the help of the Standard toolbar (Figure 4.2).
The first 10 buttons are used to zoom in or out on X/Y axes or move the view interval to the left/right/upwards/downwards.
Click  button to choose the intervals. Then press the left mouse button and drag mouse cursor to the selected interval. button to choose the intervals. Then press the left mouse button and drag mouse cursor to the selected interval.
Click  button to move the coordinate origin to the center of an active window. button to move the coordinate origin to the center of an active window.

Figure 4.2: Standard toolbar Hint: if you change the intervals with the help of the Standard toolbar the steps of the ticks and labels are changed automatically. If you change intervals with the help of the Document Properties dialog, the steps of the ticks and labels will be changed if the "Change steps when interval changed" option is ON (Edit | Options). - Plot options . The first two options (Number of Points and Maximum Gap) are used as default graph parameters for some types of graphs (see Chapter 3 for more information).
The Point Align option is a very special option. It's used rarely but it may be useful too. If the Point Align check box is ON, the X, Y, A or T parameters will accept values, equal to K * Point_Interval, where Point_Interval is equal to the interval of the appropriate parameter divided by the number of steps. Thus, if an interval includes 0, one value always will be calculated for the value of the parameter, equal to 0. Thus, in some cases the number of calculated points will be equal to the number of steps (instead of number of steps + 1). If the switch is OFF, the values of the function always will be calculated for the values of the parameters, corresponding to the boundary values of the interval. However, if the interval includes 0, it is possible that no value will be calculated for the parameter equaling 0.
This option is usually used when the number of points is small.
Example: graph of Y(x)=x^2, number of steps is 7 (Figures 4.3 and 4.4).
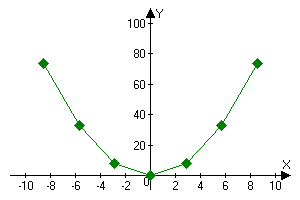 Figure 4.3: Point align is ON | 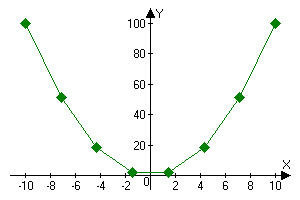 Figure 4.4: Point align is OFF |
- Coefficients. The actual values on the axes are equal to visible values, multiplied with the coefficients at the appropriate axes. At the determination of intervals on X and Y in this window or in additional properties, numbers are used, which afterwards will be multiplied with a coefficient. In a map of points, however, the coordinates of which were calculated (or are given in a table), the coordinates then are reduced according to the coefficients. For example, if the coordinate Y of a point in a table is equal to 6 and the coefficient on the y-axis is equal to 2, the coordinate of the point on the screen is 6/2 = 3.
Coefficient parameters can be used, for example, to plot graphs of trigonometrical functions. If it is the Y(x) graph, the coefficient on the x-axis can be specified as 3.1415927. Thus, the numbers on the x-axis will show fractions of Pi. You can also do it with the help of the Graphs | Sets of Properties | Trigonometrical Set command.
- Logarithmic scale. If you want to use logarithmic scale, select the corresponding check box (X-Axis or Y-Axis). You can also set logarithmic base. If the logarithmic scale is ON, all intervals will be represented in the base^num format. If you set the interval on X to -2..2, the logarithmic base on X to 10 and the logarithmic scale on X to ON, the actual interval will be 10^-2..10^2.
Legend
Legend is very useful if you print graphs or create illustrations. If the description of the graph isn't defined its formula (or number of items) is shown in the legend. Otherwise the description is shown. You can change the description of a graph with the help of the Graph Properties dialog (see Chapter 3). Hint: the description of the graphs is shown in the graph list too (e.g. "Y(x)=2.5/x [Isoterm]", "Isoterm" is a description of the graph). Example: Figure 4.5. For the graph of an equation the description is defined ("Ellipse"). But for the graph of the inequality the description isn't defined so its formula is shown in the legend. 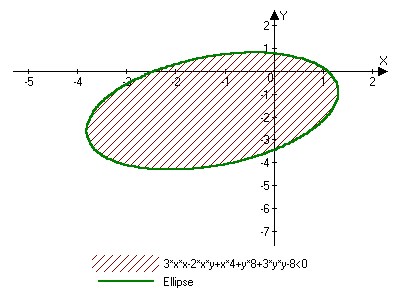
Figure 4.5: Graph with legend You can change the options of the legend with the help of the Legend page. You can also set the legend ON/OFF with the help of the menu that appears when you click the right mouse button on the graph window (Figure 4.6). 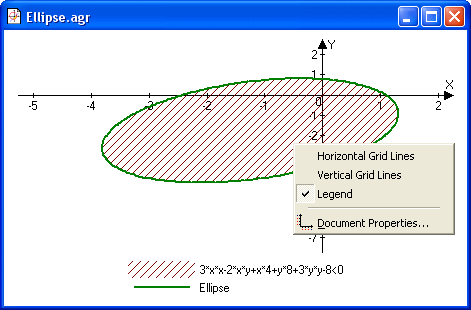
Figure 4.6: Use this menu to change the properties of the coordinate plane |


